Research
Jump to:
Mapping and monitoring wetlands
Monitoring surface inundation in wetlands is important for understanding the ecosystem services they offer, including the regulation of regional hydrology, water quality and greenhouse gas cycling. Existing methods for detecting wetland inundation using satellite imagery are often inadequate due to the complexity of wetlands in both space and time. Funded by NASA's Land Cover and Land Use Change (LCLUC) programme, my research involves the use of data from a diverse set of Earth Observation satellites, including NASA's Landsat and the European Space Agency's Sentinel-1 and Sentinel-2 satellites. By combining optical (Landsat and Sentinel-2) with radar (Sentinel-1) data, we can track inundation dynamics over time at much higher temporal frequency than is possible with only one sensor type. Below is a demonstration of how these data sources can be used together to characterize temporal inundation profiles in the Florida Everglades.
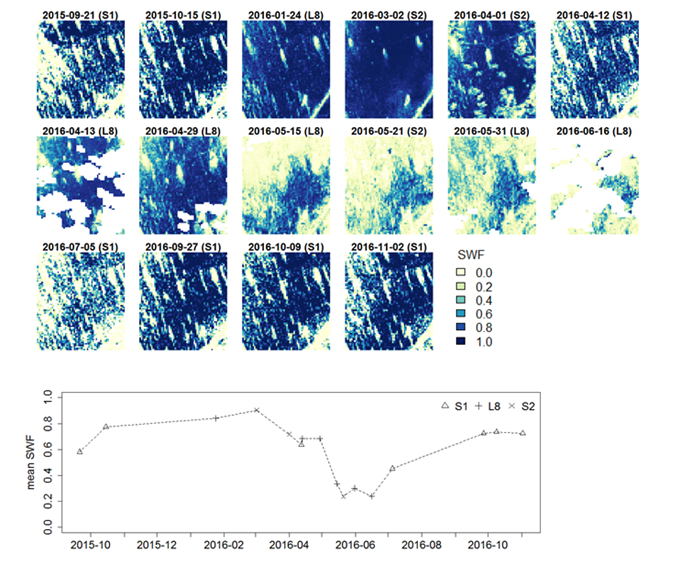
Read more about this project here.
Flood inundation monitoring
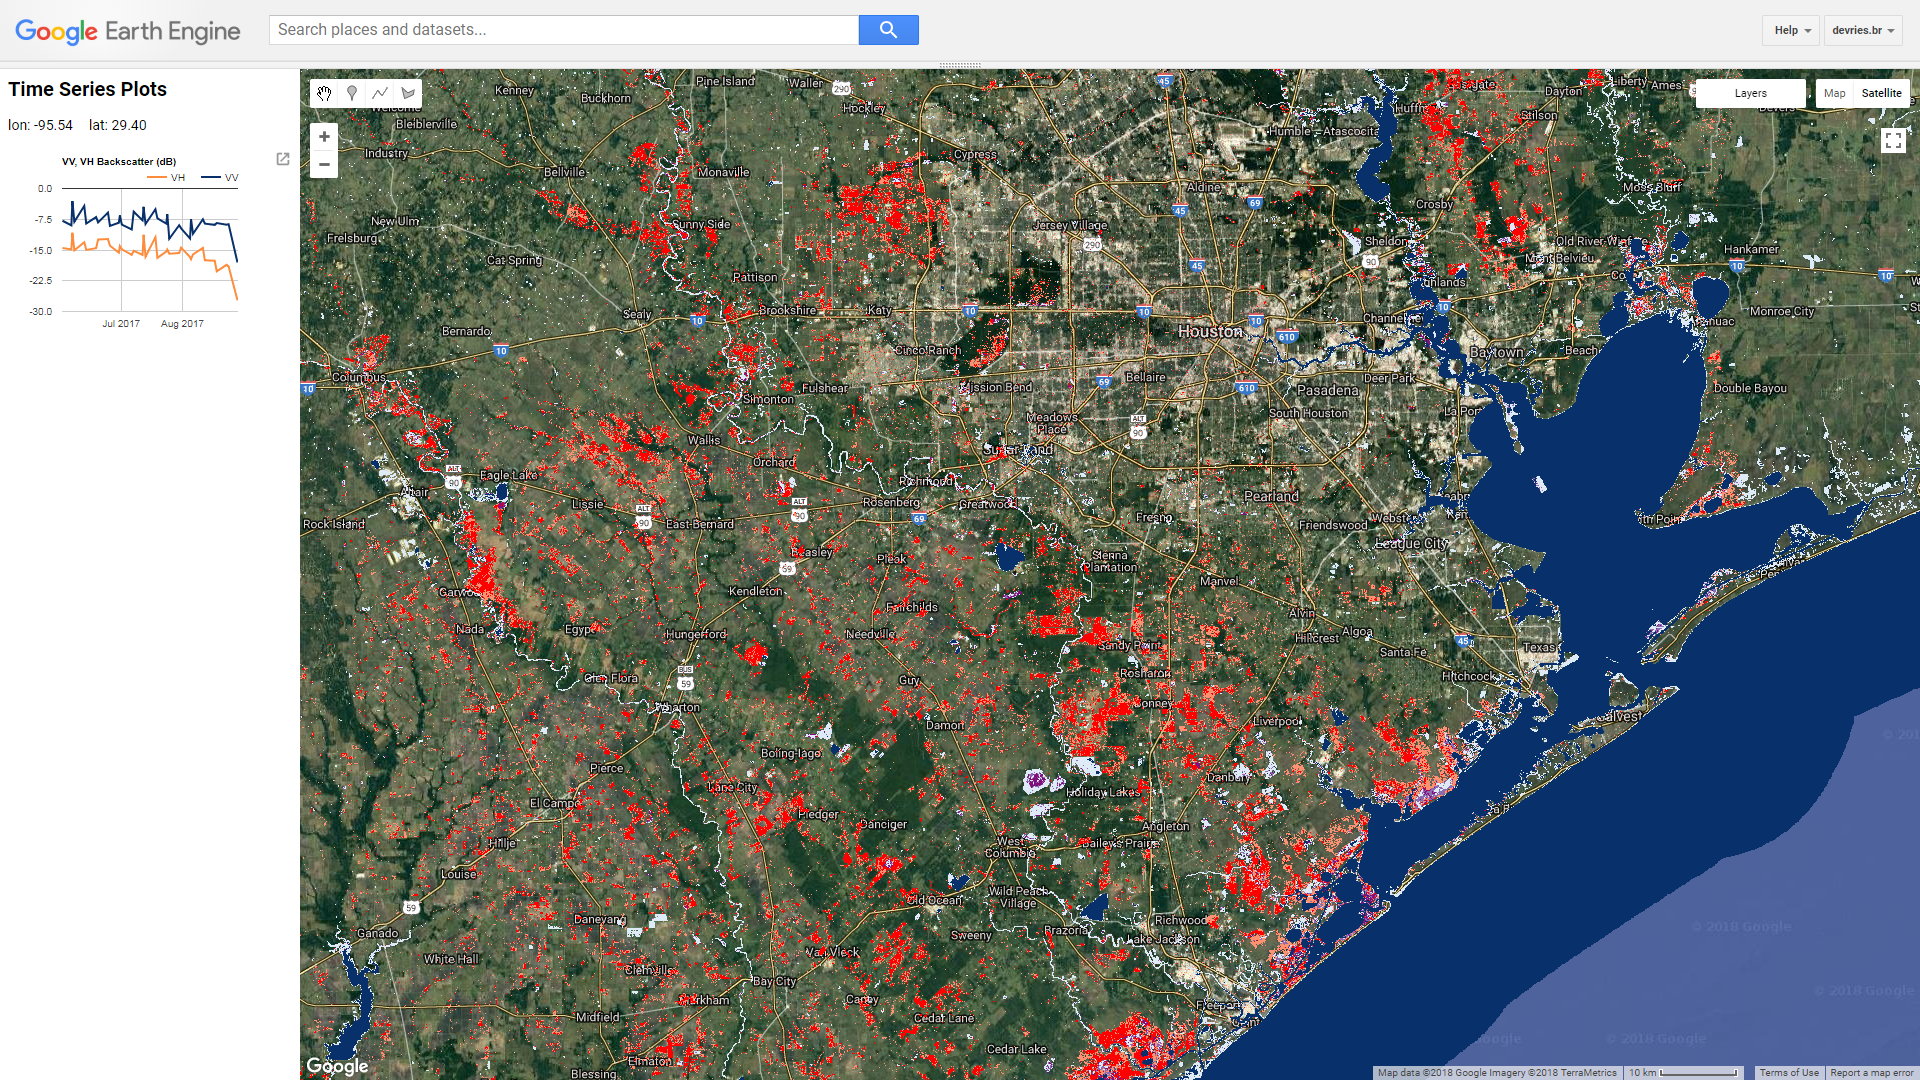
In my current research, I am also interested in the use of radar and optical data to track flood disasters in near real-time. Imagery from radar satellites are not affected by cloud cover, and are therefore instrumental in high-frequency monitoring of flood events, during which cloud cover is often problematic for optical sensors. I am developing methods to use Sentinel-1 radar data on the Google Earth Engine to map potentially catastrophic floods in near real-time. Below is an example of how this novel platform can facilitate disaster response through the rapid processing of image time series data
Forest change in the tropics
My PhD dissertation describes approaches to monitoring change dynamics in tropical forests using dense Landsat time series and ground observations. In my research, I explored ways in which these data can be used to monitor deforestation, degradation and regrowth. Below is an example of the bfastmonitor method over a site in southern Ethiopia. In this study, I showed that by using all Landsat observations, small-scale deforestation could be tracked fairly well. Without reliable ground-based observations, however, degradation was nearly impossible to track. Working with local communities, I showed in another study that high-detail characterization of deforestation and degradation in these complex forest systems is indeed possible with dense Landsat time series when used together with observations from the ground.
In addition to my work in southern Ethiopia, I published another of my PhD chapters describing a method for the automated detection of post-disturbance regrowth using Landsat time series. I demonstrated the method in Madre de Dios, southern Peru, an area characterized by rapid forest change in recent years due to conversion to pasture and small-scale gold mining operations.
Graduate research opportunities
For more information on graduate research opportunities, click here.